Skip to content

Our work

The system, the report, and the results.

Four artefacts, labelled honestly. Two show how we track an account — sample layouts, built on a real client-grade system. Two are real seller-panel screenshots from accounts we have operated, anonymised by category.

The tracking system

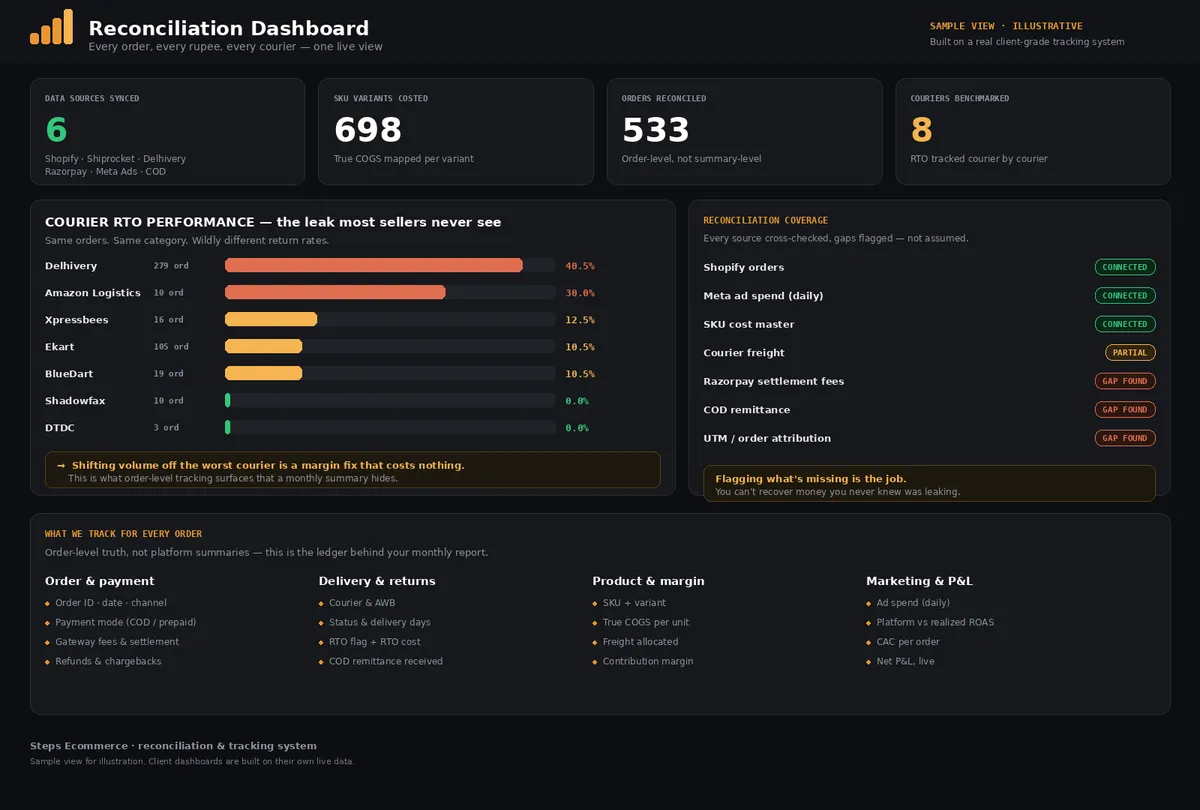
Order-level reconciliation, not platform summaries

Every order, every rupee, every courier in one view — settlement gaps flagged rather than assumed, and RTO benchmarked courier by courier.

Reconciliation dashboard showing orders reconciled, courier-by-courier RTO rates and a reconciliation-coverage panel flagging gaps in settlement, COD remittance and attribution data

Sample view · illustrative — client dashboards are built on their own live data

What you get every month

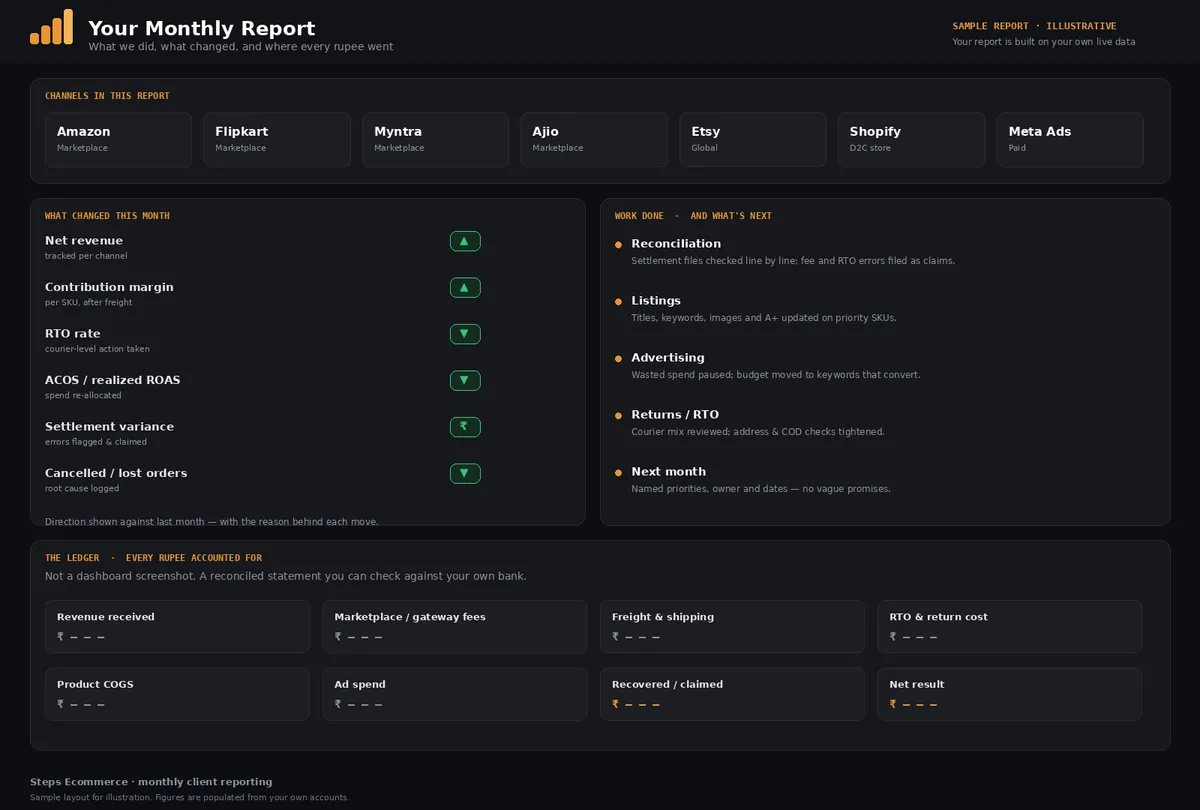
A reconciled statement you can check against your bank

What changed, what we did, and where every rupee went — across all your channels. Direction and reason for each move, not a slide deck of vanity metrics.

Monthly client report layout showing channels covered, what changed this month with direction indicators, work done and next month's priorities, and a ledger of revenue, fees, freight, RTO cost, COGS, ad spend and net result

Sample layout · illustrative — figures are populated from your own accounts

Footwear · Amazon India

537 units and ₹5.14L in a month

Up from 107 units and ₹1.4L a year earlier, after rebuilding the catalogue, running ads to a margin-derived target and reconciling settlements.

Amazon seller dashboard showing 537 units and ₹5.14L in sales

Real seller-panel screenshot · anonymised by category, no client name

Footwear · Flipkart

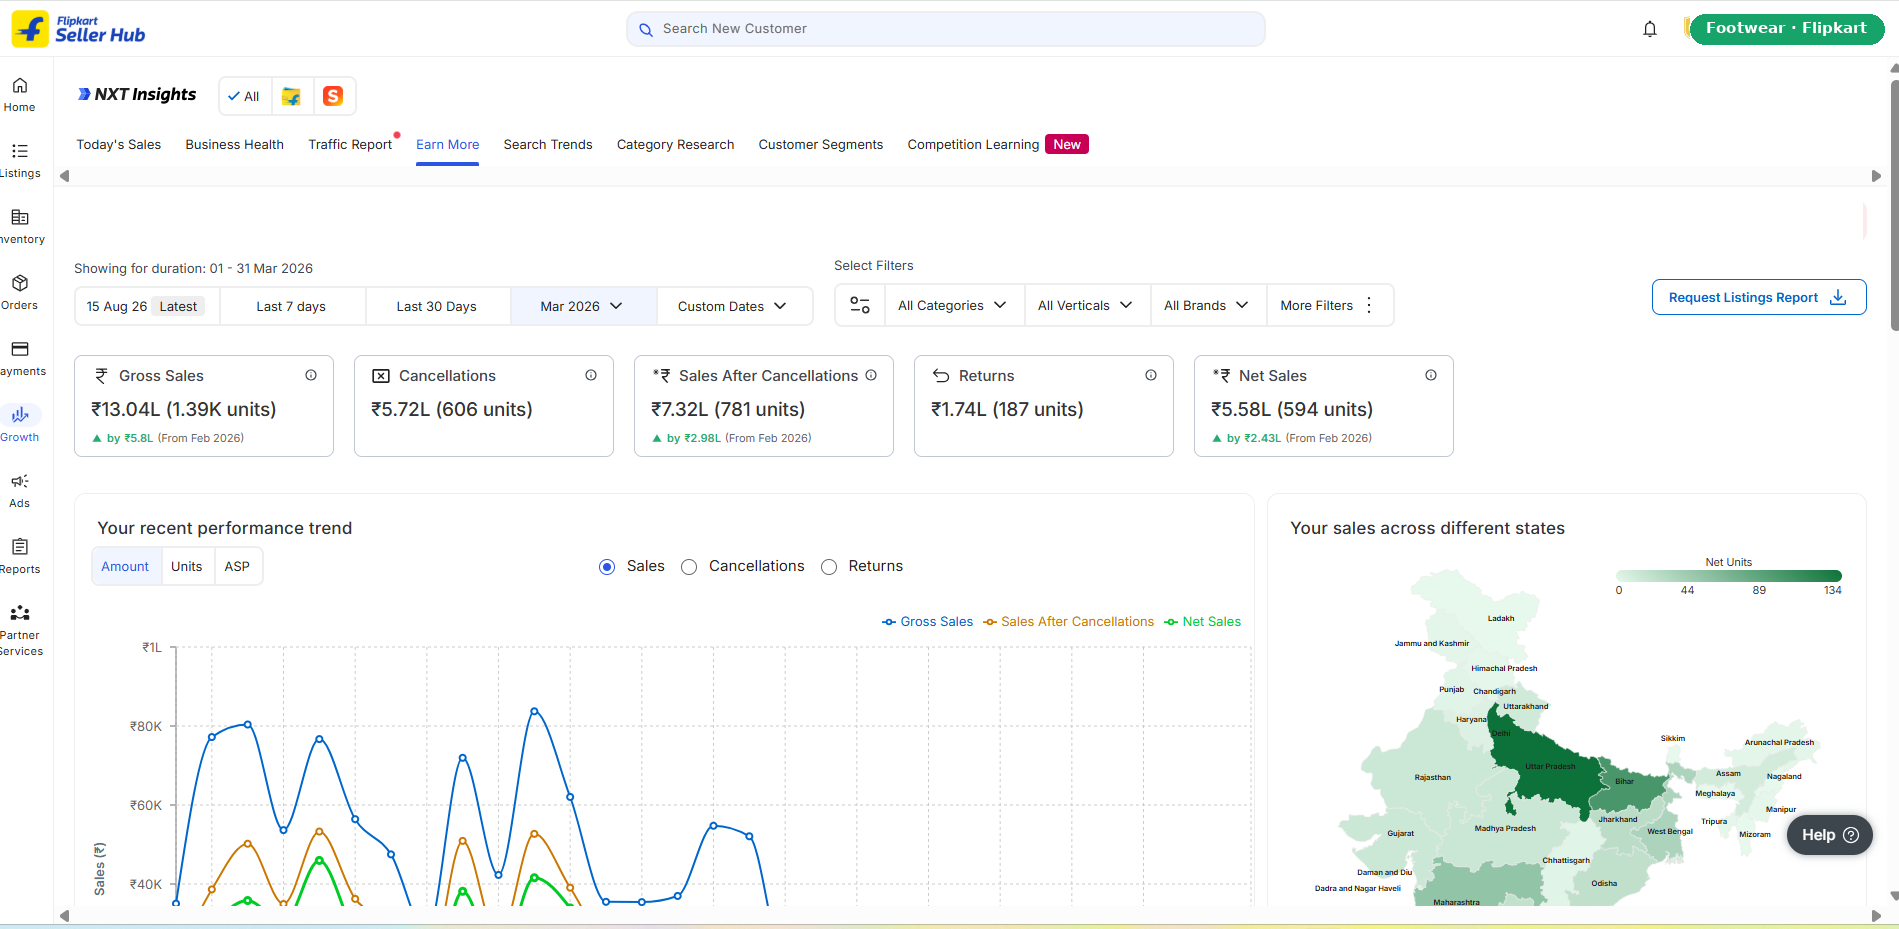
₹13.04L gross — and the ₹5.58L net behind it

The gap between the dashboard headline and the money that lands is the whole point: we manage to the net number, after returns and deductions.

Flipkart seller dashboard showing ₹13.04L gross and ₹5.58L net sales

Real seller-panel screenshot · anonymised by category, no client name

Scan reports

Real accounts. Real numbers. Shown the honest way.

Every case study is labelled by category — like “Footwear · Amazon + Flipkart” — with the actual figures and screenshots from accounts we've operated. No invented names, no borrowed logos. Ask for references on your diagnosis call.

Footwear · Amazon India

SCAN REPORT
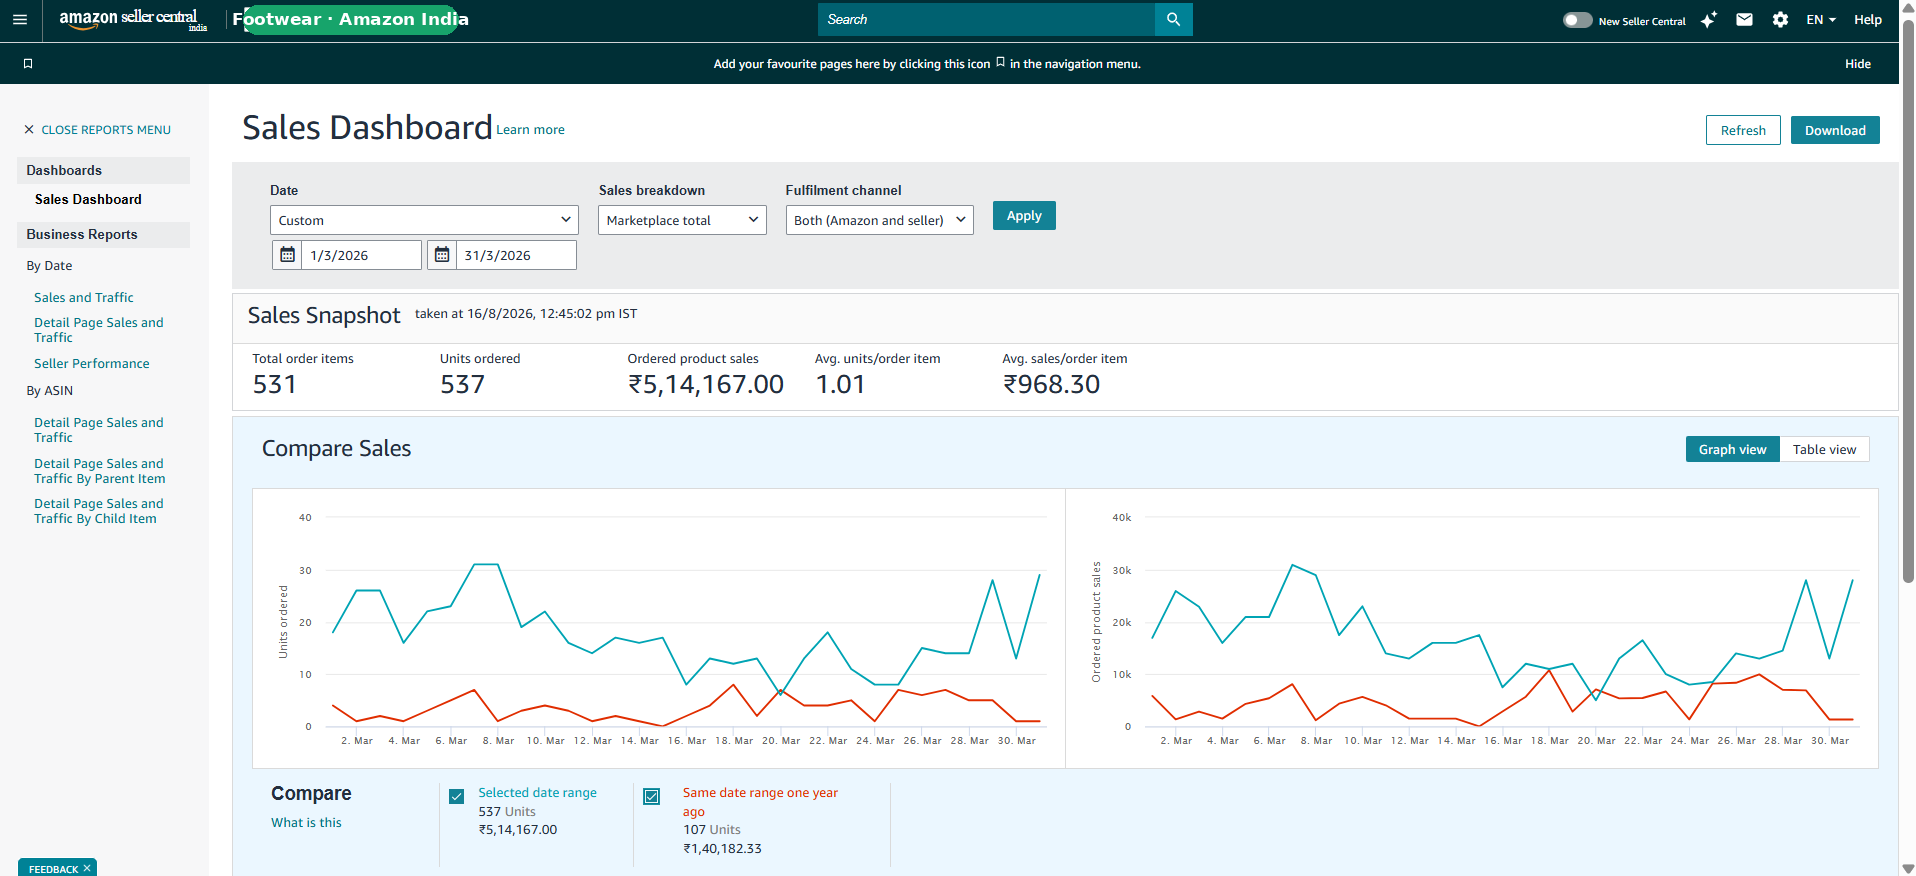
Amazon seller dashboard showing 537 units and ₹5.14L in sales

Problem: A footwear account selling steadily but well below its potential: catalogue and advertising were never run to a target, and year-on-year growth had flattened.

What we did: Rebuilt the listings and catalogue structure, ran advertising to a margin-derived target, and reconciled settlements so the growth wasn't quietly given back in fees and return charges.

Units sold537
Sales₹5.14L

Footwear · Flipkart

SCAN REPORT
Flipkart seller dashboard showing ₹13.04L gross and ₹5.58L net sales

Problem: Gross sales looked healthy on Flipkart, but returns and deductions meant the net figure told a very different story from the dashboard headline.

What we did: Worked the returns and RTO side alongside listings and campaigns, and reconciled the settlement file line by line so the net number — not the gross — became the number we managed to.

Gross sales₹13.04L
Net sales₹5.58L

How we present results: every figure we publish comes from a real account we have operated, shown by category. When clients give written permission, we'll show named results too — never before.

Start with the diagnosis

Find the constraint first. Then decide what to fix.

No package pitch before we understand the account. The diagnosis shows you the evidence — the scope comes after, in writing.